Custom Scoring On All Your Data
Optimize your marketing campaigns, your sales team performance, and have detailed views of where you should be investing your time and attention. Produce both quick, simple reports for weekly trends, and comprehensive trend reports.
Free Trial, Cancel Any Time
Start Scoring Leads

Need a Quick Guide?
Here’s all you need to do to get your data in a functional, measurable report:
- Gather Data: Use your custom statuses and mark the good leads, the bad calls, and the awkward form submissions.
- Create a report and give it a name
- Filter your report. Need the number of wins from the last 7 days?
- Run your report internally – no downloading required.
- Customize your columns (no need to rerun if you wanted different ones!)
- Draw conclusions from your data.
- Change your marketing strategy to focus on the good and eliminate the ineffective.
100% money back guarantee
Generate more leads or more revenue in 30 days… or your money back.
Start Generating More Leads
Free Trial
The reports are generated based on your own custom campaigns and statuses, but are aggregated numerically to give you a solid, measurable state of your marketing outreach. Traffic, conversions, closes, and other factors are grouped together, limited only by your own customized statuses.
Free Trial, Cancel Any Time
Start Scoring Leads
Quick, easily repeatable reports
Here’s a Step-by-Step to scheduling reports:
- Name: Set the name of your report.
- Filters: Only want wins? Exclude office calls? Customize them here.
- Grouping: Grouped by if they came from a magazine, or by day? Do this with easy check-boxes.
- Email To: Sending it off? Do it from within the software – no need to download.
Update the reports with appropriate columns and trending graphs – no rerunning necessary. Happen to forget that you needed the number of closes along with the close%? Just reopen the report and add the column, and it will calculate without you needing to type in a formula. This way, it’s very easy to remove columns as well – your data is only as good as what you can exclude, not just what you include.
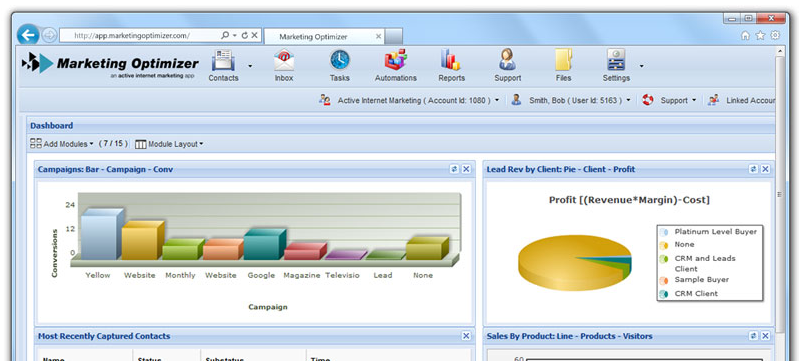
The graphs are integrated right above the numerical data and can be used to display trends alongside your totals for a quick, visual determination of how your marketing outreach is doing.
Data is automatically inserted into the graphs based on your custom report. With the graphs, outliers and trends are easier to pick out, but because it’s generated automatically, you can do it for your own needs as well as a client’s.
It’s easier to draw conclusions when only the data you want is showing, not the excess that raw data usually includes. Customizing and organizing your data the first time before you run the report rather than after the fact makes data customization easier, and analyzing quicker and more efficient.Also, the customization doesn’t have to be redone each time you want that report run – all reports are saved before they are run.
The integration between your marketing outreach and report will streamline your ROI decisions without the need to learn separate software or a formula.
100% money back guarantee.
Generate more leads or more revenue in 30 days… or your money back.